AI Makes Current Patterns Visible
- Apr 19
- 2 min read
How Temperature Data from Weather Satellites Reveal Changes in the Ocean
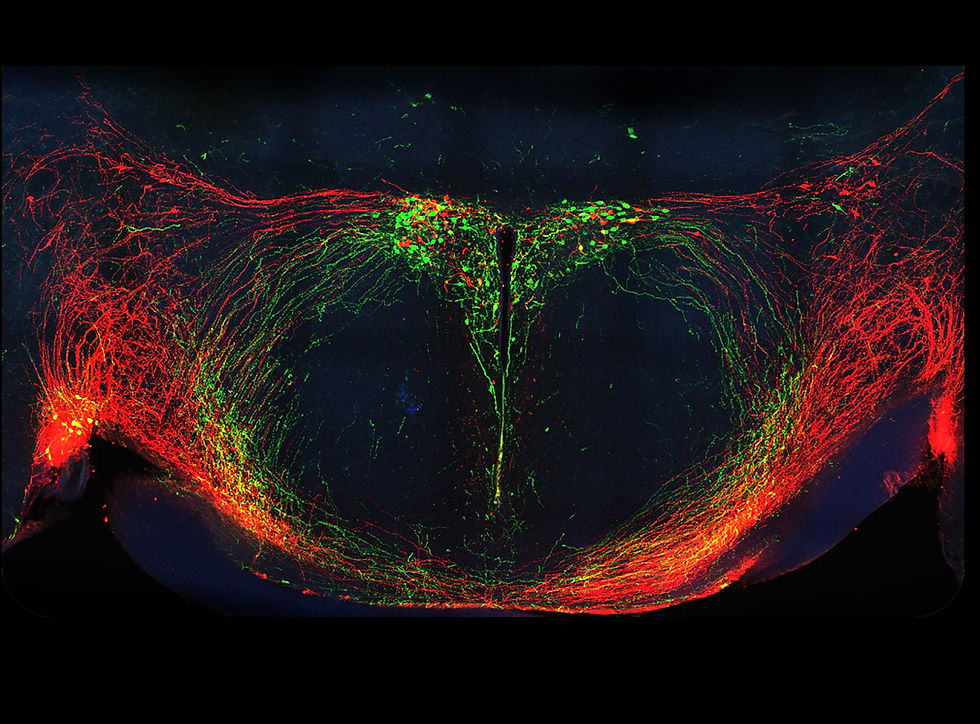
Tell-tale eddies: These colorful lines and swirls are not art, but rather depict a section of the Gulf Stream. More precisely, we are seeing the temperature patterns of the sea surface generated by this current. They were made visible by an AI model that infers the current patterns occurring beneath the ocean surface from weather data from geostationary satellites.

Whether it's the North Atlantic Current, the shifting eddies of the oceans, or the marine upwelling zones: Ocean currents play a crucial role in the Earth system. They transport heat around the globe, bring dissolved gases and nutrients from the depths of the oceans to the surface, and are an important part of global biogeochemical cycles. Accordingly, it is essential to know the characteristics of these currents as precisely as possible.
From entire oceans to small eddies
But this is anything but simple. “The problem is the enormous range of scales: it extends from entire ocean basins whose currents and eddies persist for months to movements only a few kilometers across that change within a single day,” explain Luc Lenain of the Scripps Institution of Oceanography in La Jolla, California, and his colleagues.
While ship-based measurements can detect such rapid ocean changes, they only do so in a limited area. Satellites, on the other hand, have a much broader overview, but they miss the smaller-scale, rapid changes. For example, the TOPEX/Poseidon mission measures currents based on differences in sea surface elevation—but the satellites only provide new data for the same ocean area every ten days.
With weather satellites and artificial intelligence
Now, the Scripps team has found a better solution—using artificial intelligence and data from weather satellites. These satellites measure the temperatures of the underlying sea surface at intervals of up to five minutes and with high resolution. “The breakthrough was in converting such recordings into hourly maps of ocean currents,” explains Lenain. To achieve this, he and his team trained an AI system using real-world data and simulations to “translate” the patterns measurable at the water's surface into current features.
With success, as this image shows: The system, dubbed GOFLOW, reveals the subtle temperature and velocity variations in a section of the Gulf Stream. “By capturing not only velocity but also gradients, GOFLOW can depict ocean currents on a larger and simultaneously finer scale than previously possible,” the researchers report. “This allows us to see both basin-wide circulations and the detailed spatiotemporal evolution of small-scale features.” (Nature Geoscience, 2026; doi: 10.1038/s41561-026-01943-0)
Source: University of California – San Diego